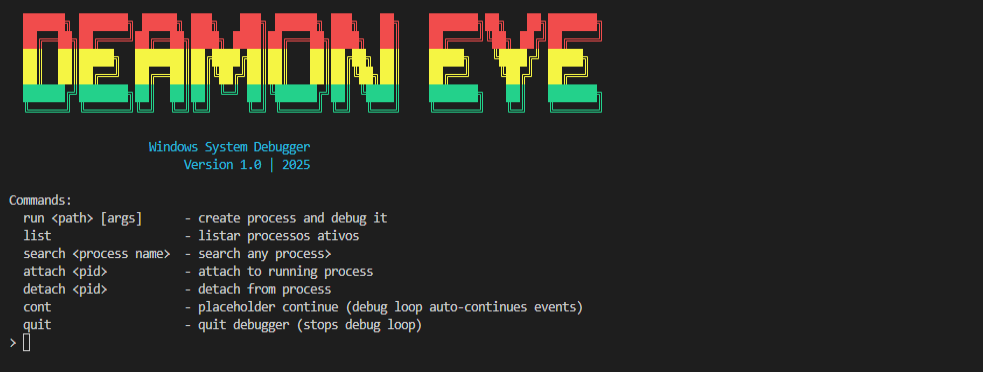
Building a Debugger from Scratch: Part 2 - Process Exploration and Debug Control

This post is a continuation of Building a Debugger from Scratch: Part 1 - Windows User-Mode Debugger Core, In this post, I want to continue building our core and implement some interesting and very important functions for the operation of a user-mode debugger.

A Function for Listing Processes
First, my goal with this function was to enumerate all running processes on the system, including their PID and executable name. This function is important for the debugger to identify the target that can be debugged.
In my implementation, I used the Tool Help API, which consists of functions that populate a PROCESSENTRY32 structure:
1
2
3
4
5
6
7
8
9
10
11
12
typedef struct tagPROCESSENTRY32 {
  DWORD dwSize;
  DWORD cntUsage;
  DWORD th32ProcessID;
  ULONG_PTR th32DefaultHeapID;
  DWORD th32ModuleID;
  DWORD cntThreads;
  DWORD th32ParentProcessID;
  LONG  pcPriClassBase;
  DWORD dwFlags;
  CHAR  szExeFile[MAX_PATH];
} PROCESSENTRY32;
Let’s look at the logic of our function:
1
2
3
4
5
6
7
8
9
10
11
12
13
14
15
16
17
18
19
20
21
22
23
24
void list_process() {
    HANDLE hSnapshot;
    PROCESSENTRY32 pe32;

    hSnapshot = CreateToolhelp32Snapshot(TH32CS_SNAPPROCESS, 0);
    if (hSnapshot == INVALID_HANDLE_VALUE) {
        printf("[!] Failed to create snapshot.\n");
        return;
    }

    pe32.dwSize = sizeof(PROCESSENTRY32);

    if (!Process32First(hSnapshot, &pe32)) {
        CloseHandle(hSnapshot);
        printf("[!] Failed to retrieve the first process.\n");
        return;
    }

    do {
        printf("PID: %-6lu | Name: %s\n", pe32.th32ProcessID, pe32.szExeFile);
    } while (Process32Next(hSnapshot, &pe32));

    CloseHandle(hSnapshot);
}
In the line hSnapshot = CreateToolhelp32Snapshot(TH32CS_SNAPPROCESS, 0); the program requests from the Windows API a photograph (snapshot) of the current set of processes. This call is the basis of the strategy: it captures a kernel state that the function can walk through with:
1
2
3
4
BOOL Process32First(
  [in]      HANDLE           hSnapshot,
  [in, out] LPPROCESSENTRY32 lppe
);
and Process32Next:
1
2
3
4
BOOL Process32Next(
  [in]  HANDLE           hSnapshot,
  [out] LPPROCESSENTRY32 lppe
);
It is important to note that CreateToolhelp32Snapshot can fail due to permission issues or resource exhaustion; therefore, the code checks for INVALID_HANDLE_VALUE and returns after printing an error: if (hSnapshot == INVALID_HANDLE_VALUE) { printf(“[!] Falha ao criar snapshot.\n”); return; }
Initializing the PROCESSENTRY32 Structure: pe32.dwSize = sizeof(PROCESSENTRY32)
Before calling Process32First, the code sets pe32.dwSize = sizeof(PROCESSENTRY32);. This step is mandatory: the API expects the caller to initialize dwSize to the correct version of the structure. Without this initialization, Process32First fails. It is also good practice to zero out the structure first (ZeroMemory(&pe32, sizeof(pe32)); pe32.dwSize = sizeof(pe32);) to ensure clean fields and avoid undefined behavior in some environments.
Retrieving the First Process: Process32First
1
2
3
4
5
if (!Process32First(hSnapshot, &pe32)) {
    CloseHandle(hSnapshot);
    printf("[!] Failed to retrieve the first process.\n");
    return;
}
Here is the point where our code starts to walk through the process snapshot created earlier with CreateToolhelp32Snapshot. The function will return FALSE if it cannot access the first process in the list, and the code handles this by closing the returned handle.
1
2
3
do {
    printf("PID: %-6lu | Nome: %s\n", pe32.th32ProcessID, pe32.szExeFile);
} while (Process32Next(hSnapshot, &pe32));
The field pe32.szExeFile is where Windows stores the process name.
An interesting technical detail is the use of the %-6lu format in printf. Although it works well on many compilers, it is safer to use %u with an explicit cast to unsigned, for example:
1
printf("PID: %-6u | Nome: %s\n", (unsigned)pe32.th32ProcessID, pe32.szExeFile);
This avoids inconsistencies on platforms where DWORD and unsigned long have different sizes, which can cause issues in cross-platform builds.

Starting the Debug Loop: dbg_debug_loop_start
1
2
3
4
5
6
7
8
9
10
11
int dbg_debug_loop_start(void) {
    if (g_debug_thread_running) return -1;
    // create thread
    uintptr_t th = _beginthreadex(NULL, 0, dbg_debug_loop_thread, NULL, 0, NULL);
    if (th == 0) {
        print_last_error("_beginthreadex");
        return -2;
    }
    CloseHandle((HANDLE)th); // thread handle not needed here
    return 0;
}
This function is responsible for kicking off the main debug loop, the one that will monitor and handle all events generated by the process being debugged. In other words, this is where the debugger really starts “working.”
Right at the beginning, there is a simple but essential check:
1
if (g_debug_thread_running) return -1;
This line basically prevents the debug loop from starting more than once. It checks if a debug thread is already running, and if so, it returns an error.
Next, we have the creation of the new thread that will handle the debugging:
1
uintptr_t th = _beginthreadex(NULL, 0, dbg_debug_loop_thread, NULL, 0, NULL);
Here, _beginthreadex is used instead of CreateThread, which is always a good practice in C programs that use the C runtime library. It creates a new thread and sets dbg_debug_loop_thread as the entry point, which is where the debug event loop actually happens. This is where the code waits for DEBUG_EVENTs, interprets each event type (such as exceptions, thread creation, DLL loading, etc.), and decides what to do next.
After creating the thread, the code checks whether everything went smoothly:
1
2
3
4
if (th == 0) {
    print_last_error("_beginthreadex");
    return -2;
}
This helps with debugging the debugger itself, since creating threads can fail for various reasons (lack of memory, permissions, etc.).
Stopping the Debug Loop: dbg_debug_loop_stop
1
2
3
4
5
6
7
8
9
10
11
12
13
int dbg_debug_loop_stop(void) {
    if (!g_debug_thread_running) return 0;
    g_terminate_debug_thread = true;

    int waitCount = 0;
    while (g_debug_thread_running && waitCount++ < 1000) {
        Sleep(10);
    }
    if (g_debug_thread_running) {
        return -1;
    }
    return 0;
}
If the previous function was the “Start Debugging” button, this one is the “Stop Debugging” button. The dbg_debug_loop_stop function is responsible for safely stopping the main debug loop, ensuring that the thread monitoring events is actually terminated before the program continues.
In the snippet:
1
if (!g_debug_thread_running) return 0;
if there is no debug thread running, there is nothing to stop. In this case, it simply returns 0, signaling that everything is fine (even though nothing was done).
Next, the code sets a global flag that tells the debug thread it should end its execution:
1
g_terminate_debug_thread = true;
This variable acts as a “stop” signal that the dbg_debug_loop_thread function (created in dbg_debug_loop_start) constantly monitors during its execution. It’s a simple form of communication between threads, where the main thread just marks that termination has been requested, and the debug thread notices this and safely exits the main loop.
An interesting snippet:
1
2
3
4
int waitCount = 0;
while (g_debug_thread_running && waitCount++ < 1000) {
    Sleep(10);
}
This waits in small 10-millisecond intervals until the g_debug_thread_running flag is cleared. The waitCount counter prevents the program from waiting forever: if, after approximately 10 seconds (1000 * 10ms), the thread still hasn’t terminated, the loop stops.
Continuing Process Execution: dbg_continue
1
2
3
4
5
6
7
int dbg_continue(DWORD pid, DWORD tid, DWORD continueStatus) {
    if (!ContinueDebugEvent(pid, tid, continueStatus)) {
        print_last_error("dbg_continue -> ContinueDebugEvent");
        return -1;
    }
    return 0;
}
Whenever a debug event occurs—whether it’s an exception, a breakpoint, or any other notification that Windows sends to the debugger—the program needs to tell the system what to do next with the target process thread. This is where this function comes in.
The core of our function is straightforward:
1
2
3
4
if (!ContinueDebugEvent(pid, tid, continueStatus)) {
    print_last_error("dbg_continue -> ContinueDebugEvent");
    return -1;
}
It calls ContinueDebugEvent, the Windows API that informs the system whether the thread that generated the event should continue execution normally (DBG_CONTINUE) or if there is an unhandled exception (DBG_EXCEPTION_NOT_HANDLED). Here, pid is the process ID, tid is the thread ID that generated the event, and continueStatus indicates the debugger’s decision on how to handle that specific event. This is a function that essentially “keeps the debugger moving.”
Searching Processes by Name: search_process
1
2
3
4
5
6
7
8
9
10
11
12
13
14
15
16
17
18
19
20
21
22
23
24
25
26
27
28
29
30
void search_process(const char *term) {
    if (!term || !*term) {
        printf("search requires term\n");
        return;
    }

    HANDLE snapshot = CreateToolhelp32Snapshot(TH32CS_SNAPPROCESS, 0);
    if (snapshot == INVALID_HANDLE_VALUE) {
        print_last_error("CreateToolhelp32Snapshot");
        return;
    }

    PROCESSENTRY32 pe;
    pe.dwSize = sizeof(pe);

    printf("--- Search results for \"%s\" ---\n", term);
    bool found = false;
    if (Process32First(snapshot, &pe)) {
        do {
            if (_stricmp(pe.szExeFile, term) == 0 || strstr(_strlwr(_strdup(pe.szExeFile)), _strlwr(_strdup(term)))) {
                printf("PID: %-6u | EXE: %s\n", pe.th32ProcessID, pe.szExeFile);
                found = true;
            }
        } while (Process32Next(snapshot, &pe));
    }
    if (!found)
        printf("(no process found)\n");
    printf("-------------------------------\n");
    CloseHandle(snapshot);
}
The search_process function acts like a magnifying glass inside your debugger, allowing you to quickly find a process by name, even if you don’t know the exact PID. This is extremely useful when working with multiple processes and needing to attach the debugger to the correct target.
At the beginning, the function performs a simple validation:
1
2
3
4
if (!term || !*term) {
    printf("search requires term\n");
    return;
}
Here, the code ensures that the user provided a search term. If nothing is provided, the function notifies the user and returns immediately, avoiding the creation of an unnecessary process snapshot.
The PROCESSENTRY32 structure is initialized to store information about each process:
1
2
PROCESSENTRY32 pe;
pe.dwSize = sizeof(pe);
Then the function begins the search:
1
2
3
4
5
6
7
8
if (Process32First(snapshot, &pe)) {
    do {
        if (_stricmp(pe.szExeFile, term) == 0 || strstr(_strlwr(_strdup(pe.szExeFile)), _strlwr(_strdup(term)))) {
            printf("PID: %-6u | EXE: %s\n", pe.th32ProcessID, pe.szExeFile);
            found = true;
        }
    } while (Process32Next(snapshot, &pe));
}
Here, the debugger iterates through each process using Process32First and Process32Next. The comparison logic allows the function to find processes regardless of case (_stricmp) and also supports partial matches using strstr.
Part 3 coming soon…
In the next part of this series, we’ll dive even deeper into the debugger internals. Expect a hands-on look at thread and memory inspection, breakpoint management, and exception handling… Thank you for reading this far…